

C-bet frequency by flop: a study of 1,755 boards
How often does the button bet after opening and getting called by the big blind? We analysed all 1,755 distinct flop suit patterns in one solved, heads-up, spot. The mean is 54.2% when each pattern has equal weight. Board texture changes that average substantially, but the aggregate is not an instruction for a particular hand.
Original analysis by Solved Hand. Published 21 October 2026.
Last updated
The findings
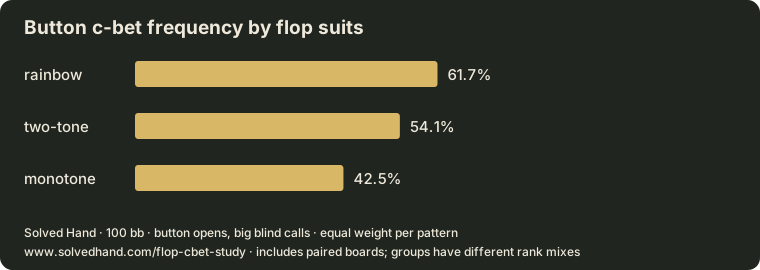
- The button bets 61.7% on , 54.1% on and 42.5% on , averaging patterns within each group.
- Holding all three ranks constant reduces the mean rainbow-minus-monotone gap to 14.5 percentage points across 286 comparisons. That is smaller than the unadjusted 19.2-point gap.
- Rainbow bets more often in 262 matched rank sets; monotone bets more often in 24. 3 comparisons differ by at most 0.2 percentage points, so their ordering is sensitive to the source rounding.
- Boards with one paired rank average 65.8%; trips average 90.1%. Those groups contain 312 and 13 patterns respectively, so a trips average describes a much smaller set.
Suit texture: the full comparison
| Flop suits | Patterns | |||
|---|---|---|---|---|
| rainbow | 455 | 61.7% | 42.7% | 19.1% |
| two-tone | 1,014 | 54.1% | 30.8% | 23.3% |
| monotone | 286 | 42.5% | 21.4% | 21.1% |
These are group descriptions. The monotone group cannot contain a paired rank: two identical ranks cannot share a suit. Rainbow includes both unpaired and paired boards, including trips. Consequently, subtracting the two suit-group means mixes a suit comparison with a change in which ranks and pair patterns are represented.
What happens when the ranks stay the same?
For every unpaired rank set, we matched its rainbow board to its monotone board. There are 286 such rank sets: each comparison keeps the high, middle and low ranks fixed and changes only the suits. Their mean difference is 14.5 percentage points in favour of more betting on rainbow. Two-tone boards are excluded from this matched comparison because three different suit placements exist for each unpaired rank set.
The direction is common, not universal. For example, AcTd7h (AT7 rainbow) bets 35.2%, while AcTc7c (AT7 monotone) bets 42.0%. This is the strongest reversal in the rounded matched set. Open those summaries to inspect the button categories and available sizes.
Even with ranks held constant, this is a comparison within one game configuration, not a causal claim that suits alone prescribe a betting rule for every range. The solver changes the strategy of the whole range, including checks, small bets and large bets. A particular starting hand may move differently from the average.
Paired boards and trips are different groups
| Patterns | ||
|---|---|---|
| Unpaired | 1,430 | 51.3% |
| One paired rank | 312 | 65.8% |
| Trips on board | 13 | 90.1% |
An average over paired boards depends on whether trips are included. Separating them makes that choice visible. It also avoids treating the unusually high trips average as a result based on hundreds of different ranks. Neither table tells you that every pair should bet or that every draw should check; the per-flop summaries show how the button's made-hand and draw categories split.
Why two valid averages give different numbers
The 1,755 patterns represent 22,100 distinct three-card deals. Suit relabellings make equivalent patterns: an unpaired rainbow pattern represents 24 deals, an unpaired two-tone pattern 12, an unpaired monotone pattern four, a one-pair pattern 12 and a trips pattern four.
Giving each pattern one vote produces 54.2%. Weighting those same per-board frequencies by the number of three-card deals represented produces 55.6%. The latter is a deal-count-weighted board average, not a forecast of betting across actual button-versus-big-blind hands. Reaching the flop with the configured ranges changes board probabilities, and the big blind's check frequency also varies. We do not estimate those joint probabilities from the public summaries.
Our headline and suit tables use equal pattern weights so every distinct board situation contributes once. The downloadable figure states that convention. Use the same convention when comparing these findings with another study; a different range, bet menu or weighting can move an average without either calculation being wrong.
Methods, precision and limits
The button opens to 2.5 big blinds, the big blind calls, and the flop begins with 5.5 big blinds in the pot and 97.5 behind each player. The big blind may check or lead one third of the pot. After a check, the button may check, bet one third or bet three quarters. Raises are to three times the bet. Every percentage in this article describes the button's after a check, rather than its response to a lead.
The stored solves report from 0.494% to 0.750% of the starting pot. Source frequencies are rounded to three decimals before aggregation. Displayed percentages round to one decimal; close matched comparisons should not be read as precise orderings. Exploitability measures convergence within the configured game, not the error bar on each frequency.
The figures are computed from the same server-only summaries as the public flop library. A reproducible test enumerates all 22,100 three-card deals, checks their suit-class multiplicities, recomputes the group means, and verifies the matched-rank comparison. No new solve, turn prediction or live hand analysis is used for this study.
These are model strategies for a fixed preflop range pair and action menu. They do not measure how people play, how profitable a bluff is against a particular opponent, or what tournament payout pressure changes. Full per-hand strategies, big blind category defence and later streets remain outside this public study.
Use the findings to choose what to study
Choose a rainbow board and its monotone counterpart with the same ranks. Read both action tables, then compare the button's category mixes. Start with a question such as whether the small bet becomes less frequent or whether checking grows across several categories. That gives you a testable observation for those boards, rather than a single rule copied from an average.
Browse the complete solved-flop library, check the solve settings and interpretation, or read the broader article on solved flop betting. The poker odds calculator answers a separate question: showdown equity for hands or ranges you enter, without solving their betting strategy.
To cite the study: Solved Hand, “C-bet frequency by flop: a study of 1,755 boards,” 21 October 2026. State the 100-big-blind button-versus-big-blind configuration and equal-pattern weighting alongside any quoted figure. The original vector chart includes its source address.